Do you follow trading rules?
Like
Comment
Share
Do you follow trading rules?







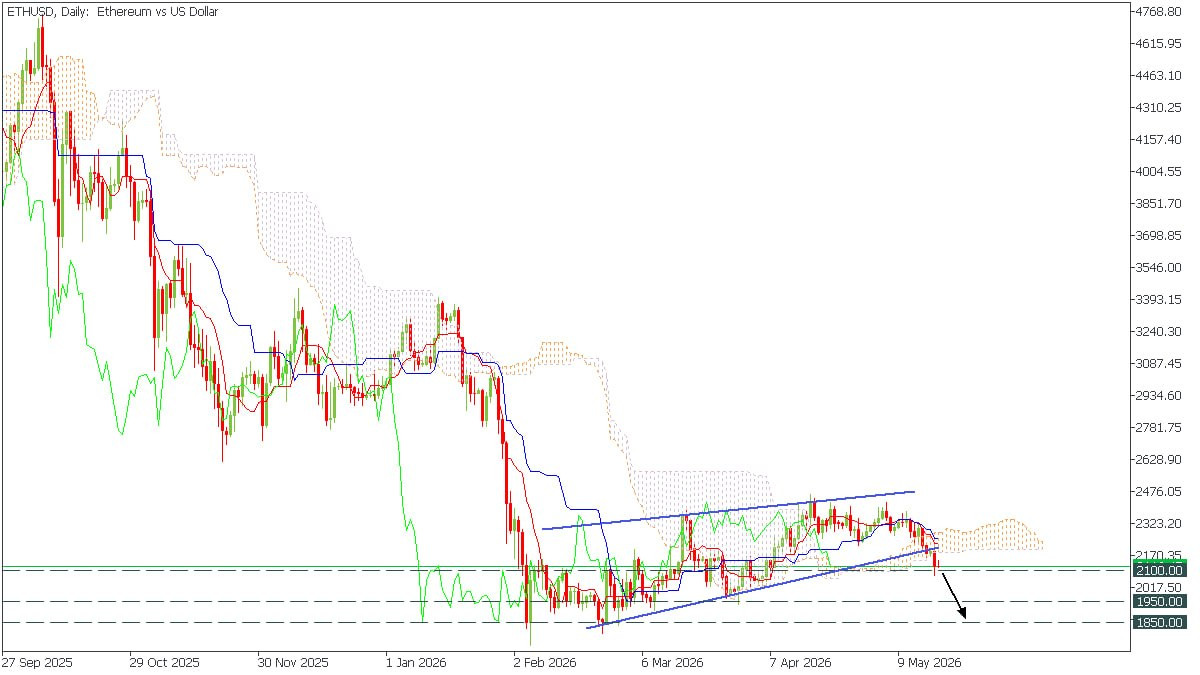
💎 ETH/USD TECHNICAL UPDATE
📊 Ethereum has broken below the ascending wedge support and exited the cloud, indicating growing bearish pressure.
🧠 MARKET STRUCTURE
📉 Breakdown confirmed below key support
📊 Ichimoku: Kijun above Tenkan → bearish continuation signal
⚠️ Momentum favors sellers if price stays below key zone
🔻 BEARISH SCENARIO
If ETH holds below 2100, downside continuation is expected:
🎯 Target 1: 1950
🎯 Target 2: 1850
📌 SUMMARY
Bearish bias remains active unless price reclaims broken structure.
💎 XAU/USD 1H UPDATE
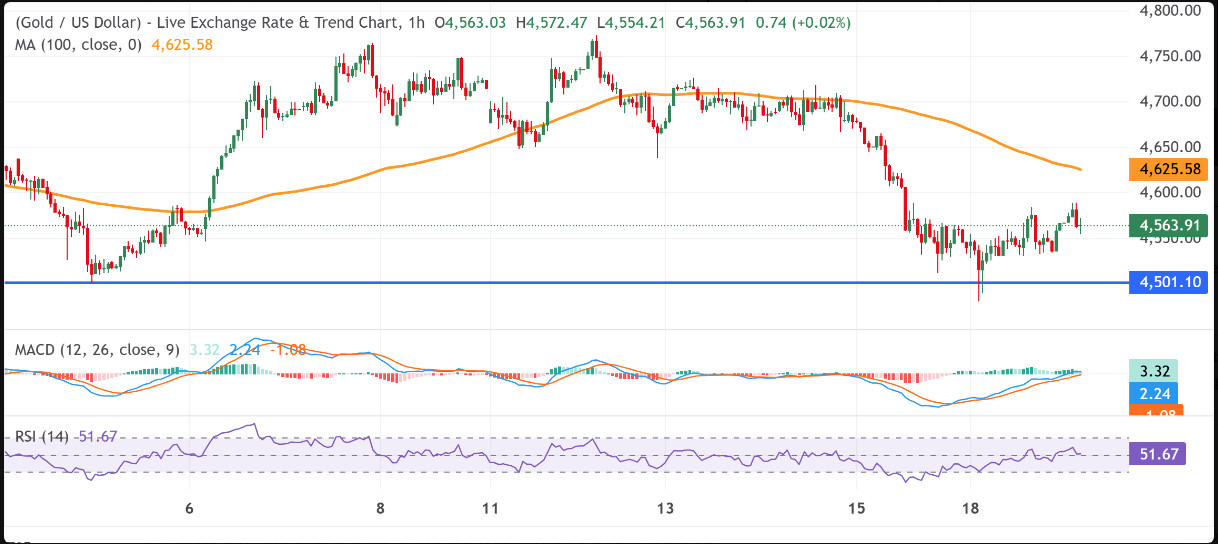
📊 Bias: BEARISH (short-term)
Gold still trades below the 100-hour SMA, keeping sellers in control.
🔻 DOWNSIDE
Break below $4,500 may lead to:
📉 $4,480 support (next key level)
📈 UPSIDE
Resistance: $4,625 (100-hour SMA)
👉 Only above here = recovery signal
📌 SUMMARY
Bearish bias remains unless $4,625 is broken.
Trade Here👇
https://cutt.ly/LtVdJ95w
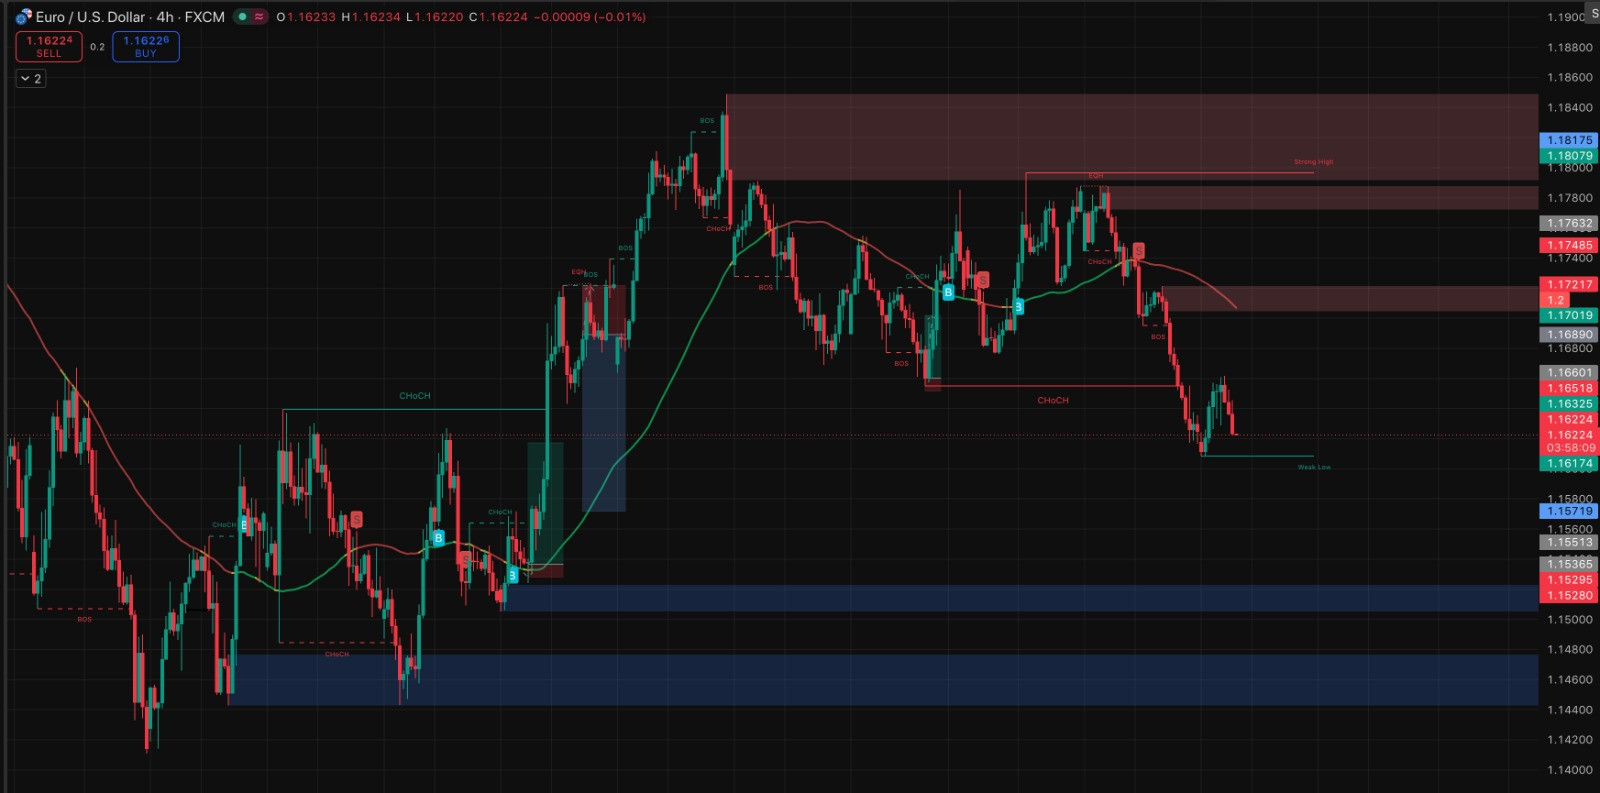
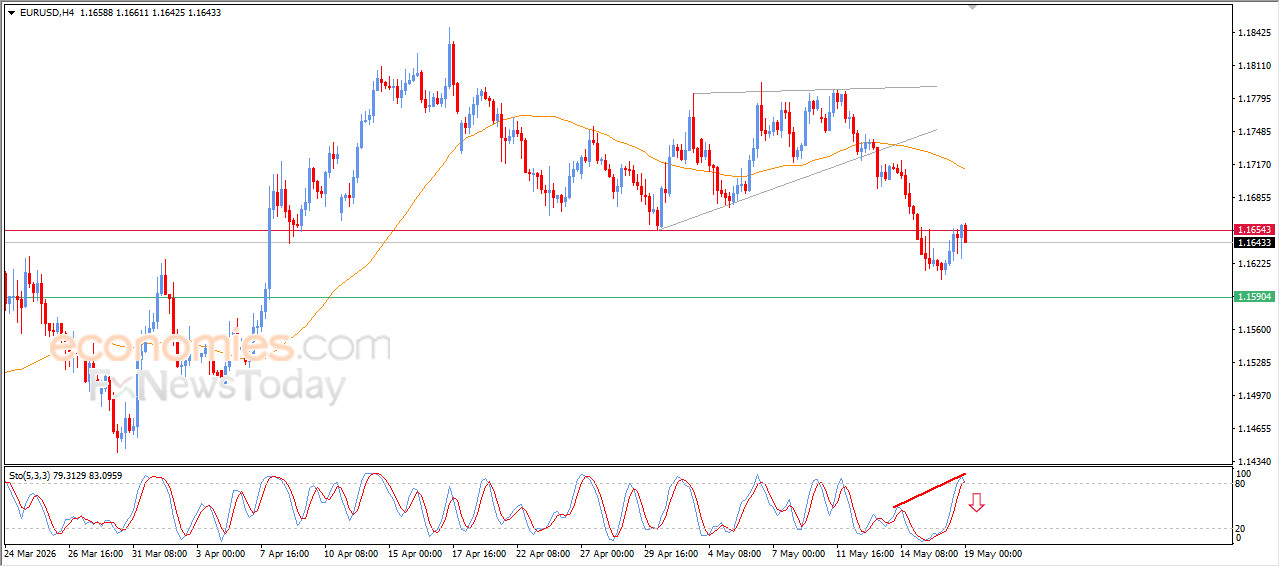
EURUSD Price Succumbs to Negative Pressure – Analysis
The EURUSD pair declined in recent intraday trading after failing to break the key resistance level at 1.1655, which remained firm and pushed the pair lower again amid the continued dominance of the short-term corrective bearish trend. The EMA50 also continues to apply negative dynamic pressure as the pair trades below it, reinforcing the bearish outlook and limiting chances of a near-term recovery.
Meanwhile, relative strength indicators have started showing negative signals, with a bearish divergence forming after reaching heavily overbought levels, alongside the ap
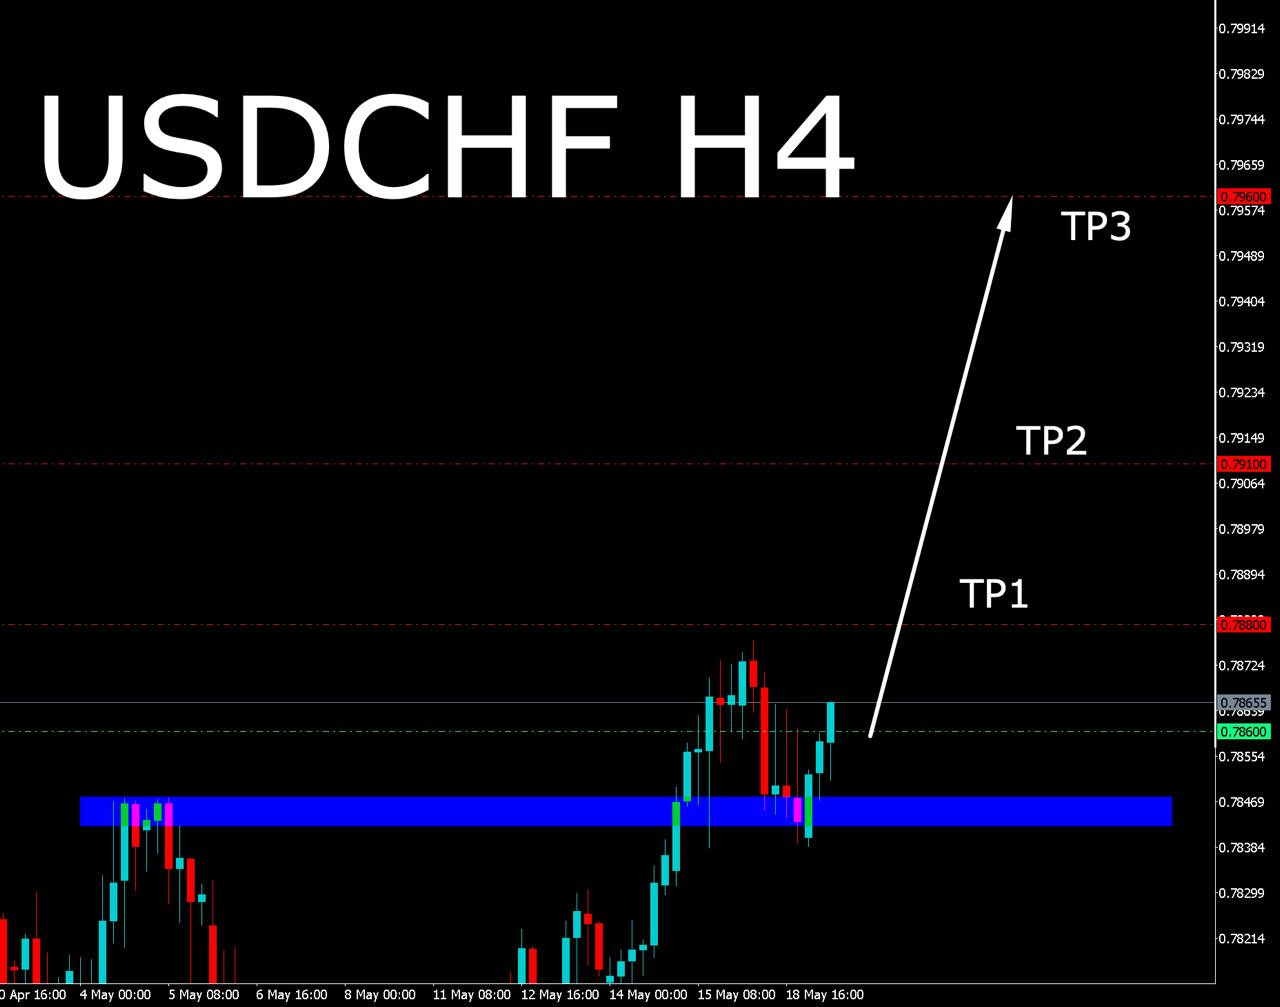
USDCHF BUY @ 0.7860
TP: 0.7880 (scalper)
TP: 0.7910 (intraday)
TP: 0.7960 (swing)
SL: 0.7795
▪️Use money management 2-3%

EURUSD Price Succumbs to Negative Pressure –
The EURUSD pair declined in recent intraday trading after failing to break the key resistance level at 1.1655, which remained firm and pushed the pair lower again amid the continued dominance of the short-term corrective bearish trend. The EMA50 also continues to apply negative dynamic pressure as the pair trades below it, reinforcing the bearish outlook and limiting chances of a near-term recovery.
Meanwhile, relative strength indicators have started showing negative signals, with a bearish divergence forming after reaching heavily overbought levels, alongside the ap
🚨 #xauusd SELL SIGNAL 🚨
🔽 SELL: 4550 – 4553
✅ TAKE PROFIT TARGETS
🎯 TP1 – 4547
🎯 TP2 – 4544
🎯 TP3 – 4541
🎯 TP4 – 4538
🎯 TP5 – 4535
🎯 TP6 – 4532
👎 STOP LOSS: 4560
⚠️ Wait for proper confirmation and manage your risk accordingly.
For more Accurates signals join us https://chat.whatsapp.com/GGhHe8Ci3SE1y9r3gfSwap


Join our WhatsApp Group to receive free daily gold scalping signals, powerful AI-driven trading robot, and premium indicators. Elevate your trading game now!
Click to join Our WhatsApp Group Link Bellow 🔥🔥🔥
https://chat.whatsapp.com/KlfiQMlnr2TA5N3uj7pvVL
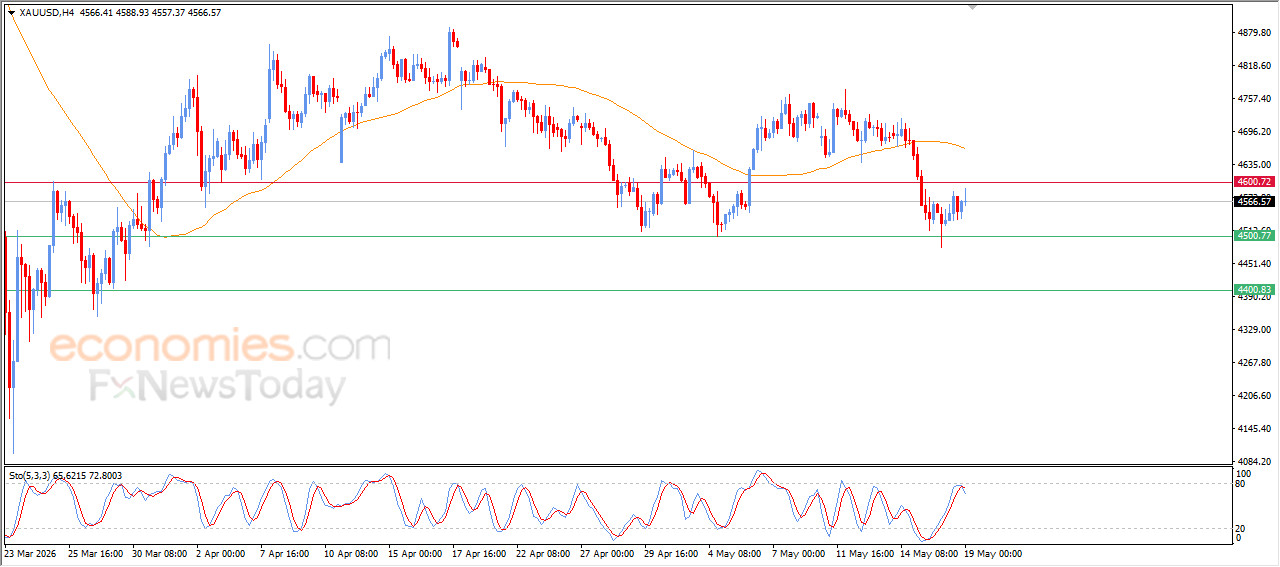
Gold Price Shows Fresh Negative Signals – Analysis
Gold price is holding onto limited and cautious gains during recent intraday trading, while a short-term corrective bearish wave continues to dominate. Negative pressure also persists as the price remains below the EMA50, which continues to limit strong recovery chances and supports the current bearish outlook.
Meanwhile, relative strength indicators began sending fresh negative signals after reaching heavily overbought levels compared to price movement, leading to form of a bearish divergence that strengthens selling pressure and increases the likelihood of gold resumin
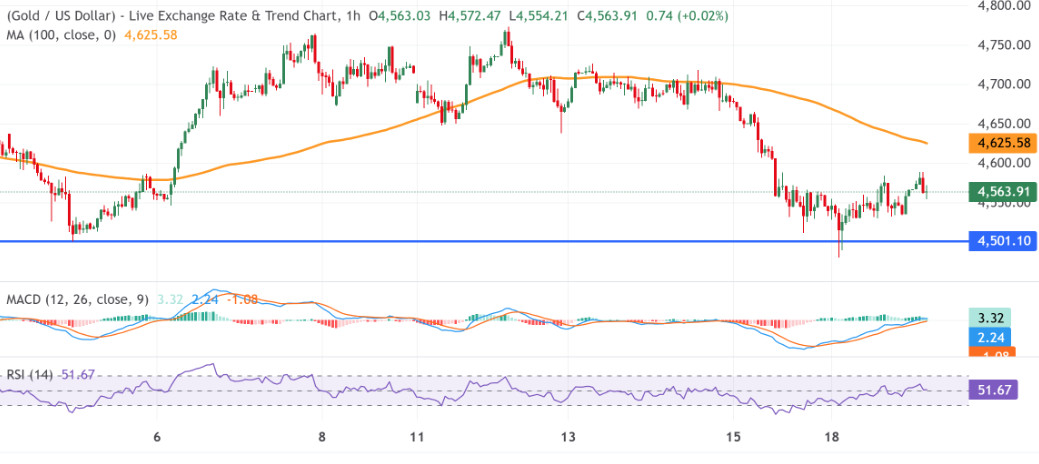
Gold bears have the upper hand while below the 100-hour SMA pivotal hurdle
From a technical perspective, the precious metal holds below the 100-hour Simple Moving Average (SMA), keeping the near-term bias bearish despite the recent rebound from lower levels. Adding to this, the Moving Average Convergence Divergence (MACD) remains in positive territory, but its latest reading at 3.32 hints at waning upside momentum. Meanwhile, the Relative Strength Index (RSI) around 51.7 suggests only modest bullish pressure rather than a decisive trend.
This, in turn, makes it prudent to wait for acceptance below the $4,500 psychological